How Much Data Do IoT Devices Generate?
Discover how much data IoT devices generate daily, from smart homes to industrial sensors, and learn about data volume trends, storage challenges, and future projections.
How much data do IoT devices generate has become one of the most critical questions facing technology leaders, data center managers, network architects, and business decision-makers as the Internet of Things explosion connects billions of sensors, wearables, smart home devices, industrial monitors, connected vehicles, and countless other endpoints creating unprecedented volumes of data that must be transmitted, processed, stored, and analyzed to deliver the intelligent insights and automation capabilities driving the IoT revolution.
The sheer scale of IoT data generation challenges existing infrastructure—estimates suggest that by 2025, IoT devices will collectively produce over 79 zettabytes of data annually, a number so staggeringly large (79 trillion gigabytes) that it defies intuitive comprehension yet represents very real bandwidth, storage, and processing requirements that organizations must accommodate through strategic planning, infrastructure investment, and architectural innovation.
Understanding how much data IoT devices generate requires examining not just aggregate numbers but the tremendous variability across different device types and use cases—a simple smart thermostat might generate just kilobytes daily reporting temperature readings every few minutes, while an autonomous vehicle produces terabytes daily from cameras, lidar, radar, and dozens of sensors capturing environmental data at microsecond intervals, and industrial IoT sensors on manufacturing equipment might fall anywhere along this spectrum depending on sampling rates, sensor types, and operational requirements. This variability makes blanket statements about IoT data volumes misleading without context about specific devices, deployment scenarios, data retention policies, and whether we’re discussing raw sensor data versus processed information actually transmitted and stored.
The implications of IoT data generation extend far beyond mere technical curiosity—data volumes directly impact cloud storage costs, network bandwidth requirements, edge computing needs, data privacy compliance, analytics capabilities, and ultimately the return on investment from IoT deployments. This comprehensive guide examines data generation across different IoT categories, factors influencing data volumes, storage and transmission considerations, growth projections, and strategic approaches for managing the deluge of data from IoT devices transforming industries and daily life worldwide.
Understanding IoT Data Generation Fundamentals
IoT data generation involves the continuous creation of information by connected sensors and devices monitoring physical and digital environments.
What Constitutes IoT Data?
IoT data encompasses the diverse information created by connected devices performing sensing, monitoring, and control functions.
Primary data types:
Sensor readings: Temperature, humidity, pressure, motion, light levels, sound, vibration, chemical composition, and countless other physical measurements.
Operational data: Device status, performance metrics, error codes, battery levels, connection quality, and health indicators.


Location data: GPS coordinates, cell tower triangulation, beacon proximity, or other positioning information.
Environmental context: Time stamps, weather conditions, and ambient factors relevant to device operation.
User interaction data: Commands, preferences, usage patterns, and behavioral information.
Video and image data: Visual information from cameras in security systems, autonomous vehicles, quality control systems, or smart doorbells.
Audio data: Voice commands, ambient sound monitoring, or acoustic analysis.
Metadata: Information about the data itself—device identifiers, firmware versions, data format specifications, encryption details.
Data characteristics: Most IoT data is time-series information—measurements taken at regular or irregular intervals, creating continuous streams of chronological data points.
Factors Affecting Data Volume
Data generation rates vary enormously based on multiple technical and operational factors.
Key variables:
Sampling frequency: How often sensors take measurements—every millisecond, second, minute, or hour dramatically affects total data volume.
Sensor type and precision: Simple binary sensors (on/off) generate minimal data; high-resolution cameras generate massive amounts.
Data compression: Algorithms reducing data size before transmission can decrease volumes 50-90%.
Edge processing: Local analysis reducing what’s transmitted to cloud—sending “temperature exceeded threshold” versus continuous raw readings.
Duty cycle: Devices operating continuously versus intermittently or on-demand.
Connectivity: Bandwidth limitations forcing lower sampling rates or reduced data resolution.
Battery constraints: Power-limited devices sample less frequently to extend battery life.
Storage policies: How long data is retained—short-term caching versus long-term historical storage.
Redundancy and error correction: Additional data ensuring transmission reliability.
Example: A temperature sensor sampling every minute generates 1,440 readings daily; sampling every second generates 86,400 readings—60× more data from the same sensor just by changing frequency.
Raw vs. Processed Data
Data volume discussions must distinguish between raw sensor data versus processed information actually transmitted and stored.
Data transformation stages:
Raw sensor data: Unprocessed measurements directly from sensors—highest volume, often processed locally.
Filtered data: Raw data with noise reduction, calibration, and quality checks applied—somewhat reduced volume.
Aggregated data: Statistics computed from raw data (averages, minimums, maximums, standard deviations)—significantly reduced volume.
Event-driven data: Transmissions only when specific conditions are met—dramatically reduced volume compared to continuous streaming.
Analyzed insights: Processed results and actionable intelligence—minimal volume compared to raw data.
Architecture impact: Edge computing enables devices to process raw data locally, transmitting only processed cloud insights—reducing network bandwidth and cloud storage requirements 90%+ while still delivering business value.
According to research from IDC, by 2025, over 55% of IoT data will be processed at the edge rather than in centralized cloud data centers, fundamentally changing data volume dynamics.
IoT Data Generation by Device Category
Data volumes vary dramatically across different IoT device types based on their sensing capabilities and operational requirements.
Smart Home Devices
Smart home IoT devices generally generate modest data volumes given their simple sensing and control functions.
Typical smart home data generation:
Smart thermostats:
- Data volume: 1-5 KB per day
- What’s measured: Temperature, humidity, occupancy, HVAC status
- Transmission frequency: Every 5-15 minutes, typically
Smart lights:
- Data volume: 100-500 bytes per day per bulb
- What’s measured: On/off status, brightness level, color settings
- Transmission: Only when state changes or manual refresh
Smart locks:
- Data volume: 500 bytes – 2 KB per day
- What’s measured: Lock status, access events, battery level
- Transmission: Event-driven when doors open/close
Smart speakers:
- Data volume: 10-50 MB per day (highly variable based on usage)
- What’s measured: Voice commands, ambient sound (if monitoring), user queries
- Transmission: Primarily when activated bya wake word
Smart security cameras:
- Data volume: 1-20 GB per day depending on resolution and recording mode
- What’s measured: Video streams, motion detection events
- Transmission: Continuous if cloud-stored, or event-triggered clips
Smart plugs:
- Data volume: 1-2 KB per day
- What’s measured: Power consumption, on/off status
- Transmission: Periodic status updates
Smart refrigerators:
- Data volume: 5-50 KB per day
- What’s measured: Temperature, door status, and potentially internal camera images
- Transmission: Periodic status plus event-driven
Total smart home: Average connected home with 15-20 devices generates 50-500 MB daily, dominated by security cameras if present.
Wearable Devices
Wearables continuously monitor personal health and activity metrics, generating moderate but constant data streams.
Wearable data generation:
Fitness trackers:
- Data volume: 1-5 MB per day
- What’s measured: Steps, heart rate, sleep patterns, activity types, GPS routes
- Sampling: Heart rate every 1-5 seconds during activity; less frequent at rest
Smartwatches:
- Data volume: 5-20 MB per day
- What’s measured: All fitness tracker data plus notifications, app data, and potentially ECG readings
- Additional data: Screen interactions, app usage patterns
Medical wearables (continuous glucose monitors, cardiac monitors):
- Data volume: 10-50 MB per day
- What’s measured: Continuous physiological data at medical-grade sampling rates
- Critical data: Real-time alerts for dangerous conditions
Smart clothing:
- Data volume: 1-10 MB per day
- What’s measured: Biometric data, posture, muscle activity
- Niche applications: Athletic training, physical therapy, occupational safety
VR/AR headsets:
- Data volume: 100 MB – 1 GB per hour of use
- What’s measured: Head tracking, eye tracking, controller position, spatial mapping
- Use case dependent: Gaming versus professional applications
Industrial IoT Sensors
Industrial IoT devices generate substantially more data than consumer devices due to higher precision requirements and faster sampling rates.
Industrial data generation:
Predictive maintenance sensors (vibration, temperature, acoustic):
- Data volume: 50 MB – 500 MB per day per machine
- What’s measured: High-frequency vibration analysis, thermal patterns, acoustic signatures
- Purpose: Detect bearing wear, misalignment, or impending failures
- Sampling: 10-100 kHz sampling rates for vibration analysis
Environmental sensors (manufacturing, agriculture):
- Data volume: 1-10 MB per day per sensor cluster
- What’s measured: Temperature, humidity, air quality, soil moisture, nutrient levels
- Applications: Climate control, precision agriculture
Energy meters and power monitors:
- Data volume: 5-50 MB per day
- What’s measured: Voltage, current, power factor, harmonic distortion
- Sampling: Millisecond-level measurements for power quality analysis
Machine vision systems:
- Data volume: 1-50 GB per day, depending on image resolution and frame rate
- What’s measured: Visual quality inspection, defect detection, and dimensional measurement
- Processing: Often edge-processed, with only defects or statistics transmitted
Process control sensors:
- Data volume: 10-100 MB per day per sensor
- What’s measured: Pressure, flow, level, chemical composition
- Critical data: Safety-critical measurements requiring reliable transmission
Oil and gas sensors:
- Data volume: 100 MB – 1 GB per well per day
- What’s measured: Pressure, temperature, flow rates, equipment health
- Remote locations: Challenge for data transmission
Total industrial facility: Manufacturing plant with 1,000 sensors can generate 50 GB – 1 TB daily,y depending on sensor types and sampling frequencies.
Connected Vehicles
Connected and autonomous vehicles rank among the highest data-generating IoT devices, es given their extensive sensor arrays and safety requirements.
Vehicle data generation:
Telematics systems (standard connected cars):
- Data volume: 25-100 MB per day
- What’s measured: Location, speed, acceleration, diagnostics, driver behavior
- Transmission: Periodic uploads when connected to WiFi or cellular
Advanced driver assistance systems (ADAS):
- Data volume: 500 MB – 4 GB per day
- What’s measured: Camera feeds, radar, ultrasonic sensors for parking assist, lane keeping, collision avoidance
- Partial recording: Of, ten only when specific events occur
Autonomous vehicles:
- Data volume: 4 TB per day (estimates vary 1-5 TB)
- What’s measured: Multiple cameras (8-12), lidar point clouds, radar, GPS, IMU, vehicle state
- Data deluge: Continuous high-resolution environmental sensing
- Processing: Heavy edge processing; only relevant segments and statistics are transmitted to the cloud
Fleet management (commercial vehicles):
- Data volume: 50-200 MB per vehicle per day
- What’s measured: Location tracking, fuel consumption, driver behavior, cargo conditions
- Business intelligence: Route optimization, maintenance prediction
Vehicle-to-everything (V2X) communication:
- Data volume: Highly variable, potentially 100+ MB per day
- What’s measured: Real-time safety messages, traffic conditions, infrastructure data
- Local processing: Most data exchanged locally, not stored centrally
According to research from McKinsey, the average connected car generates approximately 25 GB of data per hour when all systems are active, though only a fraction is typically transmitted and stored.
Smart Cities and Infrastructure
Smart city deployments create massive distributed sensor networks generating substantial aggregate data volumes.
Smart city data generation:
Traffic sensors and cameras:
- Data volume: 1-10 GB per intersection per day
- What’s measured: Vehicle counts, speeds, classifications, congestion patterns
- Video analytics: Edge processing reduces transmitted data
Smart parking sensors:
- Data volume: 1-5 KB per space per day
- What’s measured: Occupancy status, duration
- Simple data: Binary status transmitted when changes occur
Environmental monitoring stations:
- Data volume: 10-50 MB per station per day
- What’s measured: Air quality, noise levels, weather conditions
- Public health: Pollution tracking and alerts
Smart streetlights:
- Data volume: 1-5 KB per light per day
- What’s measured: On/off status, energy consumption, maintenance needs
- Efficiency: Demand-based lighting control
Water and utility sensors:
- Data volume: 5-50 MB per sensor per day
- What’s measured: Flow rates, pressure, leaks, water quality
- Infrastructure: Early leak detection and resource optimization
Public safety sensors:
- Data volume: 100 MB – 10 GB per location per day
- What’s measured: Surveillance cameras, gunshot detection, crowd monitoring
- Privacy concerns: Balanced against security needs
Total smart city: A major city with a comprehensive IoT deployment can generate 1-10 petabytes annually from millions of distributed sensors and devices.
Aggregate IoT Data Volume Statistics
Global IoT data generation has reached astronomical levels with exponential growth projected to continue.
Current Global Data Generation
Worldwide IoT data volumes reflect the massive scale of connected device deployment.
Current estimates:
Total IoT devices: Approximately 15-17 billion connected IoT devices globally as of 2024 (excluding smartphones and computers).
Data generation rate: IoT devices collectively generate approximately 40-50 zettabytes of data annually.
Zettabyte context: One zettabyte equals one trillion gigabytes—incomprehensibly large scale.
Growth rate: IoT data generation is growing 25-30% annually, faster than overall data creation.
IoT share of total data: IoT devices account for roughly 30-35% of all data created globally.
Enterprise vs. consumer: Industrial and commercial IoT generates approximately 70% of IoT data; consumer devices 30%.
Geographic distribution: North America and Asia-Pacific lead in IoT data generation, with Europe following, and rapid growth in developing markets.
Projected Future Growth

IoT data volumes will continue to experience explosive growth driven by proliferating device deployments and increasing data collection per device.
Growth projections:
2025 estimate: 79 zettabytes of IoT data annually (midpoint of various forecasts).
2030 projection: 150-200 zettabytes annually (highly uncertain given rapid technology changes).
Device growth: Expected 25-30 billion IoT devices by 2030 (doubling from current levels).
Per-device increase: Not just more devices, but each device generating more data through enhanced sensors and capabilities.
Driving factors:
- 5G enabling higher-bandwidth applications
- Edge AI processing enablesmore sophisticated data collection
- Autonomous vehicle proliferation
- Smart city expansion
- Industrial IoT adoption maturation
- Agricultural IoT deployment
Uncertainty factors: Regulatory changes, privacy concerns, bandwidth constraints, or economic conditions could significantly impact projections.
Industry-Specific Breakdowns
Data generation varies dramatically by industry sector, reflecting different IoT applications.
Industry data volumes:
Manufacturing: Largest industrial IoT data generator—predictive maintenance, quality control, process optimization.
Transportation and logistics: Connected vehicles, fleet tracking, autonomous systems.
Healthcare: Patient monitoring, diagnostic devices, hospital infrastructure.
Agriculture: Precision farming, livestock monitoring, environmental sensing.
Energy and utilities: Smart grid, pipeline monitoring, renewable energy optimization.
Retail: Inventory tracking, customer behavior, supply chain optimization.
Smart buildings: HVAC optimization, occupancy sensing, energy management.
Consumer/residential: Smart homes, wearables, personal IoT.
Relative contributions: Manufacturing and transportation together account for 40-50% of total IoT data generation.
Data Storage and Management Challenges
Managing IoT data volumes creates significant technical and economic challenges requiring strategic approaches.
Storage Infrastructure Requirements
Storing massive IoT data volumes demands substantial infrastructure investment and architectural planning.
Storage considerations:
Cloud storage costs: At $0.02-0.10 per GB monthly for standard cloud storage, storing petabytes becomes extremely expensive ($20,000-$100,000 monthly per petabyte).
Edge storage: Local storage at IoT gateways or edge data centers,s reducing cloud transmission and storage costs.
Hybrid approaches: Combining edge, cloud, and on-premises storage based on data access patterns and retention requirements.
Hot vs. cold storage: Frequently accessed data in expensive fast storage; archived data in cheap cold storage.
Storage tiering: Automatic data movement between storage tiers based on age and access patterns.
Compression: Data compression reduces storage requirements by 50-90%, depending on data types.
Deduplication: Eliminating redundant data copies.
Data lifecycle management: Automated deletion policies removing data after retention periods expire.
Compliance requirements: Regulations mandating specific data retention periods affecting storage planning.
Network Bandwidth Implications
Transmitting IoT data strains network infrastructure,e requiring bandwidth planning and optimization.
Bandwidth challenges:
Cellular data costs: IoT devices using cellular connectivity face per-MB charges that accumulate rapidly with high-volume applications.
Network congestion: Thousands of devices simultaneously transmitting data can overwhelm local networks.
Latency requirements: Time-sensitive applications requiring low-latency transmission.
5G impact: Dramatically higher bandwidth,th enabling new applications but also potentially increasing data volumes.
WiFi limitations: Consumer WiFi networare ks struggling with dozens of connected devices.
Satellite connectivity: Remote IoT deployments using expensive, bandwidth-limited satellite links.
Optimization strategies:
- Edge processing reducing transmitted data
- Data compression
- Prioritization protocols ensuring critical data transmission
- Scheduled transmission during off-peak hours
- Delta transmission (sending only changes, not full datasets)
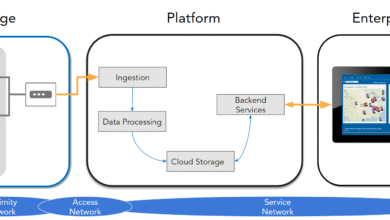
Edge Computing Solutions
Edge computing addresses IoT data challenges by processing data near its source rather than transmitting everything to a centralized cloud.
Edge computing benefits:
Bandwidth reduction: Processing locally eliminates 90%+ of data that would otherwise be transmitted to the cloud.
Latency improvement: Local processing enables millisecond responses, impossible with cloud round-trip times.
Cost savings: Reducing cloud transmission and storage costs significantly.
Privacy enhancement: Sensitive data processed locally without cloud exposure.
Reliability: Local operation continues during internet outages.
Edge processing examples:
- Autonomous vehicle: Process sensor fusion locally; transmit only navigation decisions and aggregated statistics
- Manufacturing: Analyze vibration data at the machine; send only anomaly alerts and summaries
- Security camera: Perform motion detection locally; upload only relevant clips
- Smart home: Process voice commands locally; send only final requests to the cloud
Edge architecture: IoT gateways, fog computing nodes, or intelligent devices themselves performing preprocessing, filtering, and analysis before selective cloud transmission.
Strategic Approaches to IoT Data Management
Organizations deploying IoT must develop comprehensive data strategies addressing volume challenges.
Data Reduction Techniques
Minimizing data volumes through technical approaches reduces infrastructure costs and improves efficiency.
Reduction strategies:
Intelligent sampling: Adjusting sensor sampling rates based on conditions—sampling faster when anomalies are detected, slower during normal operation.
Event-driven architecture: Transmitting data only when specific conditions are met rather than continuous streaming.
Statistical summaries: Sending averages, min/max, standard deviations instead of raw data points.
Change detection: Transmitting only when measurements change beyond thresholds.
Predictive models: Running models locally; sending only predictions and confidence levels rather than raw sensor data.
Lossy compression: Accepting some data quality loss for massive compression ratios in non-critical applications.
Time-series optimization: Specialized compression for time-series data, achieving high compression ratios.
Selective retention: Keeping detailed data short-term; aggregating to lower resolution for long-term storage.
Real-world impact: Manufacturing company reduced data transmitted from machines 95% through edge analytics while maintaining predictive maintenance accuracy.
Data Governance and Compliance
Managing IoT data requires governance frameworks addressing privacy, security, and regulatory compliance.
Governance considerations:
Data ownership: Clarifying who owns data generated by IoT devices.
Privacy regulations: GDPR, CCPA, and other laws restricting data collection and requiring deletion capabilities.
Data security: Encryption, access controls, a and audit trails protecting sensitive information.
Retention policies: Legal and business requirements determining how long data must be kept.
Data quality: Ensuring accuracy, completeness, and reliability of IoT data.
Metadata management: Tracking data lineage, sources, and transformations.
Access controls: Defining who can access what data for which purposes.
Anonymization: Removing personally identifiable information where possible.
Cross-border considerations: Data residency requirements in different jurisdictions.
ROI and Business Value
IoT data value must justify infrastructure costs and management complexity.
Value assessment:
Business outcomes: Measuring concrete benefits—reduced downtime, energy savings, improved quality, revenue growth.
Data monetization: Some organizations generate revenue by selling anonymized, aggregated IoT insights.
Operational efficiency: Quantifying savings from automation and optimization enabled by IoT data.
Customer experience: Improvements in service quality, personalization, or convenience.
Competitive advantage: Strategic benefits from insights competitors lack.
Cost-benefit analysis: Total cost of ownership, including devices, connectivity, storage, processing, and management,t versus measurable business value.
Key insight: Not all IoT data has equal value—prioritize collecting and retaining data that drives specific business outcomes rather than saving everything “because we can.”
Future Trends in IoT Data Generation
IoT data landscape continues evolving, driven by technological advances and changing applications.
AI and Machine Learning Integration
AI at the edge transforms IoT from data generators into intelligent decision-makers.
AI/ML trends:
Edge AI: Running machine learning models directly on IoT devices or gateways,s enabling real-time intelligence without cloud connectivity.
Predictive capabilities: Devices learning patterns anpredictng future states or failures.
Automated optimization: Self-tuning systems adjust operation based on learned performance.
Anomaly detection: AI identifying unusual patterns indicating problems or opportunities.
Natural language processing: Voice-enabled IoT devices understand complex commands.
Computer vision: Sophisticated image analysis in cameras and visual sensors.
Data volume impact: Edge AI dramatically reduces transmitted data by sending only insights and alerts rather than raw sensor streams.
5G and Connectivity Evolution
Next-generation networks enable new IoT applications with different data characteristics.
5G implications:
Higher bandwidth: Supporting data-intensive applications like real-time video analytics, augmented reality, and autonomous vehicles.
Lower latency: Enabling time-critical applications requiring millisecond response times.
Massive device density: Supporting more connected devices per square kilometer.
Network slicing: Dedicated virtual networks optimized for different IoT applications.
New use cases: Applications impossible with 4G/LTE are becoming viable.
Data volume paradox: 5G enables both higher-volume applications AND more efficient edge processing, reducing transmitted data.
Sustainability and Green IoT
Environmental concerns drive focus on sustainable IoT data practices.
Green IoT considerations:
Energy efficiency: Reducing the power consumption of devices and data transmission.
Data center impact: Cloud storage and processing consume massive amounts of electricity—pressure to optimize.
Carbon footprint: Accounting for the environmental costs of data storage and transmission.
Optimization motivation: Sustainability goals align with cost reduction through efficient data practices.
Renewable energy: Data centers powered by renewable sources are reducing environmental impact.
Device lifecycle: Designing for longevity and recyclability.
Conclusion
How much data do IoT devices generate depends enormously on device type, sampling frequency, and use case—ranging from kilobytes daily for simple sensors like smart thermostats and door locks to terabytes daily for autonomous vehicles equipped with multiple cameras, lidar, and radar systems continuously capturing environmental data, with aggregate global IoT data generation reaching approximately 40-50 zettabytes annually as of 2024 and projected to surpass 79 zettabytes by 2025 driven by proliferating device deployments and increasing per-device data collection capabilities.
The data generation challenges extend beyond mere volume to encompass network bandwidth constraints limiting transmission of sensor data from remote locations, storage costs that become prohibitively expensive when attempting to retain years of high-resolution data from thousands of devices, processing requirements for extracting actionable insights from raw sensor streams, privacy and security concerns from collecting personal data through connected devices, and compliance obligations requiring specific retention periods or deletion capabilities depending on regulatory jurisdiction.
Organizations successfully managing IoT data volumes employ strategic approaches including edge computing that processes data locally, transmitting only processed insights and alerts rather than raw sensor streams (reducing bandwidth 90%+), intelligent sampling adjusting data collection rates based on operational needs, event-driven architecture,s transmitting only when specific conditions occur rather than continuous streaming.
Data lifecycle policies automatically moving infrequently accessed data to cheaper cold storage or deleting after retention periods expire, and compression technologies reducing storage requirements by 50-90% depending on data types—all while focusing investments on collecting and retaining data that demonstrably drives business value through improved operational efficiency, predictive maintenance, enhanced customer experiences, or other measurable outcomes rather than indiscriminately saving all possible data simply because sensors can generate it, recognizing that the future of IoT lies not in maximizing data volume but rather in intelligent, sustainable approaches extracting maximum value from minimal essential data.